Looking an expert team?  +91-74286 23211
If you want to understand user behavior with Google analytics for improving your business, look no further as you are in the right place. For the past 15 years, Google Analytics helps to track and report web traffic. Launched by Google in 2005, it is still the widely used web analytics service with an SDK to collect information from both Android and iOS apps. But it is also best for increasing conversions and ROIs of advertising campaigns by understanding the site user behavior.

Image credit: dribble.com
Check out nine tips to use Google Analytics for understanding user behavior for transforming marketing efforts to business goals.
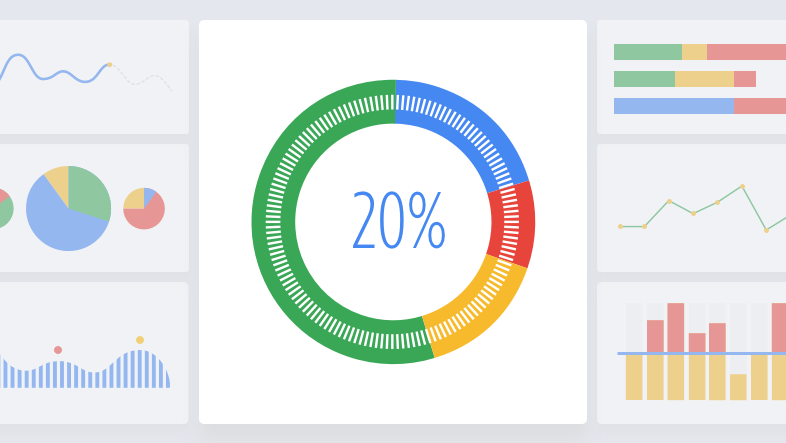
Image credit: Support.bigcommerce.com
Google Analytics is a powerful web tool that does not need additional configuration to uncover user behavior stats. It includes how the users viewed the site, the interesting content, and which page they exited from it. These valuable user insights will help you understand what motivated your users to buy the products or services. It is one of the significant needs for today's digital market success, and you can grow your business with it to new heights. Hence, find the following nine tips for using Google Analytics reports and a few custom configurations to increase conversions and ROI.
The place to find: Behavior > Behavior Flow
The users' navigation through the site gets visualized in Behavior. It will help the users install SEO Pro Extension, journey to the home page and other pages after landing on the 'Thank You page. With such a flow, it is easy to get an idea of how to place the interlink pages and CTA. Furthermore, it will help the consecutive users to follow the same navigation route specifically created for them.
Additionally, it is easy to change the flow settings for traffic sources, landing pages, users, and events. Also, from the Behavior Flow report, it is easy to find a few that include
The place to find: Audience > User Explorer
The first tip of Behavior Flow will show the aggregate user journeys, but this user will also show the full story of every user's journey. Using no personal identification, the users get identified by a Client Id here.
It is easy to check every user's number of sessions, and digging deep into these sessions will help to view the pages they visited, goals or events triggered, and the traffic sources. With eCommerce tracking, it is even possible to see the Customer Lifetime Value. The information in the report is so much that it is essential only to check for the need and not get overwhelmed with all of it.
The place to find: Audience > Audiences to create Admin > Audience Definitions
This Google Analytics report helps to better understand specific audiences of people who visited the site or left it after adding the product to the cart but without buying it. It is easy to use the audience in Google Ads also by connecting to Google Analytics. After populating the audience, it is easy to view detailed stats like the used devices, browser, traffic sources, and demographics.
The place to find Behavior> Site Search
For eCommerce websites, Site Search analysis and strategies need to improve conversion rates. Site Search enables users to view what all the users search from the site to create the right content. But Site Search requires some configuration which will take less than a minute.
Place to find: Acquisition > All Traffic > Channels
Traffic Sources is a popular Google Analytics report, showing users sources to know where they come from to check organic traffic or traffic from social media or referrals. A pro tip is to confirm to set the right medium in campaigns tracked with UTM parameters to avoid attributing the traffic to others.
The place to find: In metrics of specific reports like Traffic Sources, Landing Pages & others
Average session duration shows the time of the last access session, which is easy to calculate by dividing the total session duration in seconds by the number of sessions.
Pages/Session shows the number of pages visited by the user in a single session.
Bounce rate is fundamental when only one hit occurs for a session
All the above metrics are best when used only in the proper context. Since it is easy to manipulate these metrics, it is important to use them only as additional KPIs and not as significant ones.
The place to find: Behavior > Site Content > Landing Pages/Exit Pages
These Google Analytics reports help analyze and understand if the user journeys were expected by knowing which page they landed and exited.
The official In-Page Google Analytics add-on will help add more insights into user behavior by clicking tracking and heat maps.
Apart from the rich features of the default Google Analytics, many things help track and understand the audience better.
Goals help measure when the users complete a specific action or reach a particular destination on the site.
Events like the number of clicks, filling forms, scroll depth, and others turn into goals.
Ecommerce tracking is vital for selling products on the sides for adding the transaction code to the Order Success page.
The above nine tips of using Google Analytics reports out of the box will surely help you understand the user behavior and use those valuable insights for your marketing campaigns for maximizing the ROI and making it successful.

Digital Marketing Specialist at SEMReseller

When users start their web browser, they encounter the search bar TMPro field that displays "Search Google or type a URL." This browser command lets users use Google search services or manually specify website addresses.

User-generated content offers a strong tool to draw viewer participation as well as enhance brand recognition and enhance brand loyalty. Customers will participate through contests that promote the creation and distribution of brand-related content. As a result, this makes the customers feel valued while also providing you with authentic marketing materials. Furthermore, correctly executing this significantly improves your brand's digital footprint. This blog will walk you through the process of developing a successful UGC contest that resonates with an international audience.

If your business is heavily dependent on your website, you are likely wondering: Is AI going to take away my traffic? What about SEO?

Have you once thought about how precisely Google could determine the information you were seeking even if your search was somewhat unclear or used non-standard words? It almost feels like the search engine is tapping into your thoughts!

The secret of getting a good position on Google does not only involve great content. You may have the best post but if it is hosted on a slow-loading server, it will not get traffic from Google searches, nor will any user wait for it to load.

Business successes rely on conversions no matter what stage of operation your company currently has. Your upgrading techniques for conversions can boost your ability to capture target clients.
Have you ever had the feeling that your website is the world's largest library hidden? Amazing content has been written, a stunning site has been designed, and you know very well that the information is needed by people. But when you do a Google search for it, it's not there. Annoying, isn't it?

Everybody is familiar with the traditional game of SEO (Search Engine Optimization). First, you do keyword research, then write a post, create some backlinks, and finally pray that Google becomes aware of your existence. It seems like a drive with a map and hoping you wouldn't get missed at any point.
As soon as a Google user clicks to your website a clock starts to tick. If your site is slow or the text keeps moving while the user is reading or the button response at the other end is slow, then the user leaves your site. A single, irritated pressing of the "back" button means you lose traffic, interaction, and possibly even sales.

When you type a question into Google and hit Enter, you're talking to one of the world's smartest computer programs. These computer programs are called search engine algorithms, and they are the secret formula for discovering the most suitable answer out of billions of web pages.
Your email address will not be published.
Required fields are marked *